There are four main generations in the workforce: Baby Boomers, Generation X, Millennials, and Generation Z. Each generation is different, and with each generation comes different values, work styles, needs and challenges. Below are some statistics on each generation to give an overview of where they stand in the workforce:
Baby Boomers:
- In 2011, there were more people 55 and older active in the workforce than any time in the past 30 years. (Bureau of Labor Statistics)
10K Baby Boomers are reaching retirement age every day. (AARP)
41% of Baby Boomers do not want to quit working once they reach retirement age. (AARP)
50% of Boomers see themselves working until the age of 70 or more, but 36% said they will never be able to afford retirement. (AARP)
Baby Boomers are twice as likely to start a new business as millennials and 24.3% of all new entrepreneurs are between 55 and 64. (the Kaufmann Foundation)
Gen X:
Gen X makes up 31% of the total US income and 35% of the population. (Forbes)
Gen X outspends all other generations when it comes to housing, clothing, eating out and entertainment. (US department of labor)
Generation X has the most college degrees at 35% compared to 19% of Millennials. (forbes)
55% of startup founders are from Gen X. (Forbes)
- Nearly three-quarters of Gen Xers (70%) prefer to work independently. (Center of Talent Innovation)
66% of Gen X women and, 55% of Gen X men want flexible work arrangements. (Center of Talent Innovation)
Millennials:
- Expected to make up at least 44% of the workforce by 2025.
- 60% of Millennials said a sense of purpose is part of the reason they chose to work for their current employer. (Deloitte)
- 87% of Millennials say professional development or career growth opportunities are very important. (Gallup)
- Millennial turnover costs the U.S. economy $30.5 billion annually. (Gallup)
- 93% of Millennials left their company the last time they changed roles. (Gallup)
Gen Z*
- 91% say that a company’s technological sophistication will impact their decision to accept a job offer.
- 75% willing to start at the bottom and work their way up.
- 61% willing to stay 10 years at a company.
- 56% would rather write their own job description.
- 30% would take 10-20% pay cut to work for a company with a mission they care about.
- 78% prefer to communicate face-to-face.
*Source: Gen Z @Work
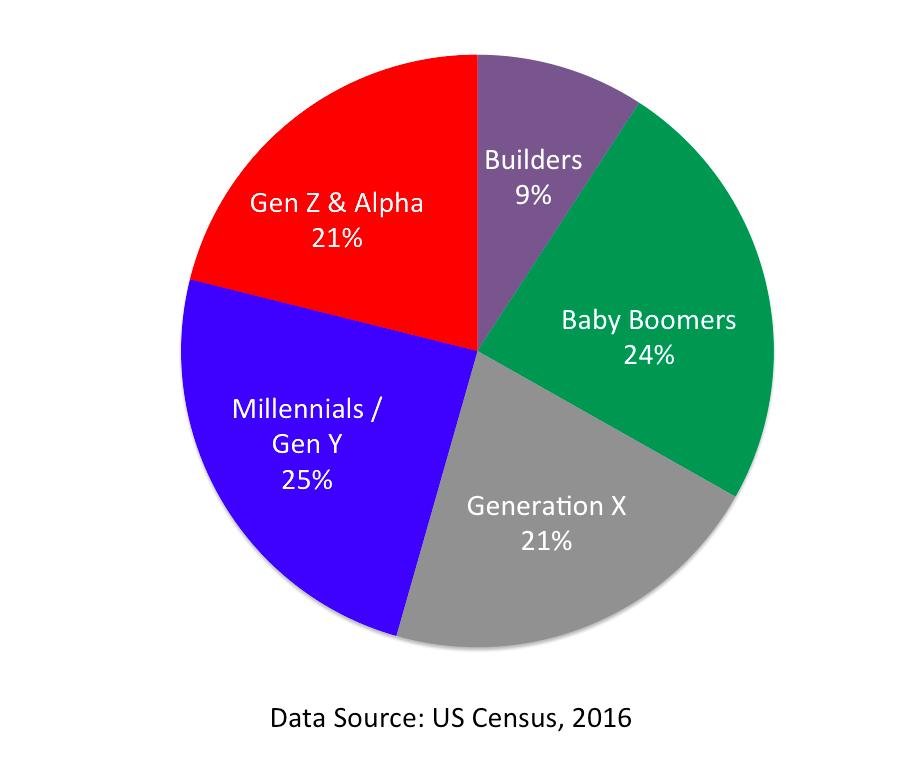
US Population per Generation
Age 36 and younger = 46% of population & it will continue to grow
While this is a quick overview of generations, it’s important to note that these statistics are all big picture. Not everyone aligns perfectly with his or her generation. We must continue the intergenerational understanding and put stereotypes aside in order to support the needs and values of each generation at work and create a culture with engaged employees.


